The good news is that the reported recovery rates for almost every single material category in Ontario’s Blue Box have improved over the last 13 years, some by as much as 20

percentage points. The bad news is that several categories have made very little progress and lag way behind the others, and that the real recovery rates are much lower than those reported.
Here is our Report Card by material group, based on the latest recovery numbers from Stewardship Ontario. Please note that this is not a judgement on the merits of individual materials but rather an assessment of how well they are being recovered in Ontario’s Blue Box system. There is clearly room for improvement.
| PRINTED PAPER | A |
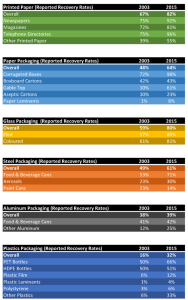
Printed paper has been a consistent good performer, rising from 67% reported recovery back in 2003 to 82% today (2015). The recovery rate for old newspapers and old telephone books is in the 90s. Somewhat further back, and dragging the printed paper category down, is the recovery rate for printing and writing paper (Other Printed). This has ranged from 39% up to 59% and is currently at 55 per cent.
| GLASS PACKAGING | B+ |
The reported recovery rate for clear and coloured glass is an impressive 80 per cent. Years ago, all we heard about was glass going to landfill or being used as road fill. Beyond talk of glass breaking in the collection process and contaminating loads of other materials, however, glass recovery is apparently in good shape. A lot of recovered glass these days goes into blast and filter media rather than higher end uses such as fibreglass and cullet which have more demanding quality requirements.
| PAPER PACKAGING | B |
Old corrugated containers (OCC) or boxes have the highest reported recovery rate of all Blue Box materials (98%). From there it’s a drop back to paper-based gable top cartons which have surged from a 10% to a 61% recovery rate; boxboard at 43%; followed by aseptic cartons (made of paper, plastic and aluminum), and laminants. The relatively low recovery rate for old boxboard is a concern. It reached as high as 65% recovery in 2008 but has dropped back to 43% since. Stewardship Ontario did target boxboard toothpaste cartons, toilet paper roll tubes, tissue boxes and other toiletry packaging in an advertising campaign in 2015.
| STEEL PACKAGING | B |
The latest reported recovery rate for steel food and beverage cans is a respectable 71 per cent. Other steel packaging such as aerosols and paint cans drag the overall steel category down 10 per cent. In fact, paint cans are the only category in the Blue Box whose recovery rate has declined over the last 13 years.
| ALUMINUM PACKAGING | D |
The low reported recovery rate for aluminum food and beverage cans in Ontario (42%) has always been a bit of a puzzler and is frequently compared unfavourably with its far higher recovery rates in Canada’s many deposit provinces where recovery ranges between 61% and 97 per cent. One reason offered for the difference is that the recovery rate for cans in Ontario is only for those that end up in the home. It doesn’t include those used at public events, in offices, or factories. The aluminum stewards also reported residential sales some 13% lower in 2015 than what various waste audits used to provide a provincial total suggested was in the home. But even if you allow for this difference, the reported recovery rate only rises to 48 per cent. We doubt that Blue Box scavengers are grabbing the other 52 per cent.
| PLASTICS PACKAGING | D |
The reported recovery rate for plastics packaging reached 32% in 2015. The highest rate was for PET bottles (66%) and the biggest increase over the years was turned in by the “Other Plastics” category with one-third now being reported as recovered. Apart from PET and HDPE bottles, however, the plastic recovery rates are poor.
The far uglier truth about all reported Ontario Blue Box recovery rates, however, is that they don’t tell the real story. They are basically “sent for recycling numbers,” in most cases, what was sent to an end-market from a material recycling facility or MRF. These reported “recovery” rates don’t deduct the various yield losses that occur in remanufacturing that curbside material back into new products, or the contamination that must be removed (and is normally landfilled) before remanufacturing can actually take place.
For example, all reported paper numbers need to be shaved by at least 10% because paper fibres shrink in the re-pulping process. When a municipality sends 100 tonnes of paper to a paper recycling mill, only 90% of it will come out the other end. And with single-stream collection there is a lot more plastic, glass and metal contamination in the paper bales. This is usually sent to landfill. And you can chop maybe 30% off the reported PET bottle “recovery” rate since PET yields at the end-market range, at best, between 60 and 70 per cent.
A recent attempt by the Canadian Standards Association to grapple with this issue and come up with a definition of recycling, falls short in our view, and is one of the reasons why PPEC is developing a more accurate and real measurement of what paper materials are actually being recycled in this province.
P.S. In our last blog on the Blue Box, we claimed that “over 75%” of what the Ontario Blue Box collected in 2015 was paper of one kind or another. The “alternative fact” is 74.55%. Close but not correct. Sorry!

Source: PPEC

Analysis of Stewardship Ontario Blue Box data between 2003 and 2015

I am confused regarding the rates for glass. Through Steward Edge I have not seen high rates for glass recovery, even negative figures related to the cost of collection and disposal. Could you offer some elaboration please.
I am a professor at Carleton University dealing with sustainability/circular economy issues with a special interest in Life Cycle Analysis and the efficiencies of reprocessing post-consumer (and other) waste materials.
I would appreciate your thoughts.
Thanks Brian. According to Stewardship Ontario data from 2003 to 2015, glass recovery (clear and coloured combined) has varied between 59% and 91 per cent. “Recovery” means sent for recycling, not actually recycled. Other SO data (2015) indicates the gross cost of collecting this glass through Ontario’s Blue Box was $10.86 million; that revenues (on a 3-year rolling average) were $1.75 million or just over $20 a tonne; and therefore that the net cost was $9.11 million or $105.33 a tonne. I suggest you check with SO for more details.